Test setup and results …
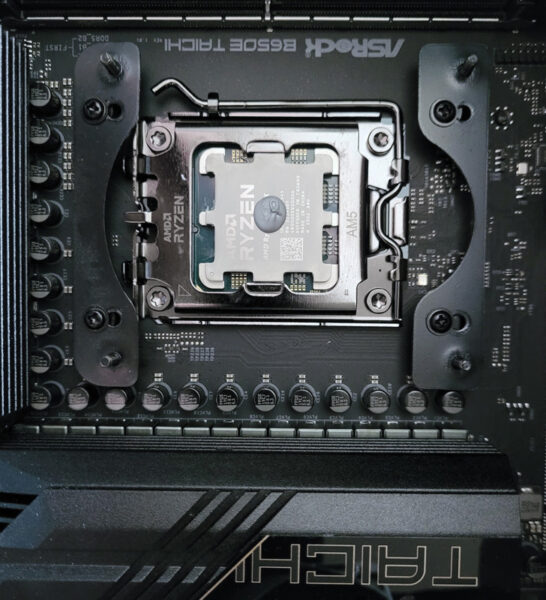
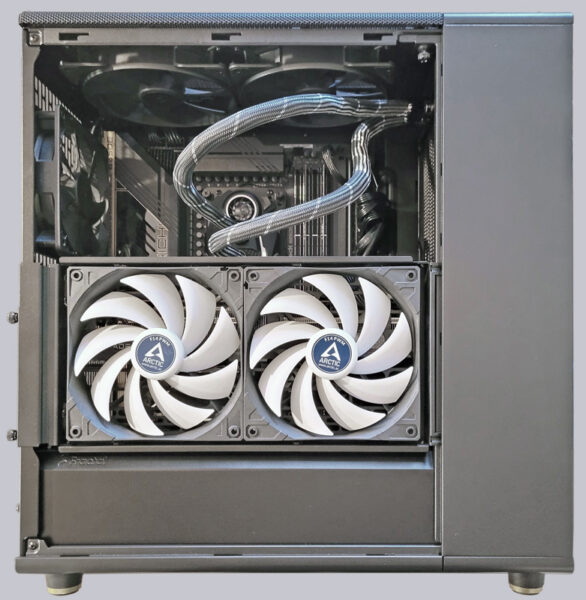
Our test system consists of the following components.
| Motherboard | ASRock B650E Taichi with M.2 PCIe 4.0 x4 interface |
| SSD | Crucial P5 Plus 1TB M.2 PCIe 4.0 NVMe-1.4 CT1000P5PSSD8 |
| CPU | AMD Ryzen 5 7600X |
| RAM | 2x Crucial 16GB DDR5-5600 |
| PSU | Cooler Master V750 Gold |
| Graphics card | AMD Radeon RX6800XT |
| Case | Fractal Design North |
| Cooler | Arctic Liquid Freezer II 360 |
| Operating system | Windows 11 – Version 21H2 |
For this thermal paste comparison test, we use our AMD Ryzen 5 7600X test system and load the CPU with the Cinebench R23 benchmark for 20 minutes. Meanwhile, we determine the maximum temperature of each CPU core. The lower the determined temperature, the better the performance of the thermal compound.

“Fortunately” at the time of testing, the weather was consistently bad with completely overcast skies, so we had a high but constant 27.0°C in the room during the test period. The ambient temperature was determined with a K-Type sensor directly in front of the fans of the Arctic Liquid Freezer II 360 water cooling system.
The AMD Ryzen 5 7600X CPU was overclocked to 5665MHz with PBO and ECLK tuning during the test and had a constant power consumption of 113W. The maximum temperature was set to 95°C in the BIOS and was not reached in the test even with enough distance, ensuring that the motherboard does not keep the CPU temperature at the same temperature in all 3 tests by throttling.
For the sake of form, we would like to point out that we try to the best of our knowledge and belief to create equal conditions for each test run, but this is not a scientific work under laboratory conditions. In addition, deviating measured values can still be determined with other test specimens of identical design due to manufacturing tolerances.
But now we don’t want to keep anyone in suspense any longer and present our test results in the following table. The temperature values refer to the maximum value that was determined on the coolest core and the hottest core during the entire test phase.
| Heat transfer paste | Coolest Core | Hottest Core |
| Arctic MX-4 | 72.9°C | 83.4°C |
| Arctic MX-5 | 74.2°C | 84.6°C |
| Arctic MX-6 | 72.5°C | 83.1°C |
The table shows us that all three thermal pastes fulfill their intended function impeccably. We did not necessarily expect such a tight result beforehand. The new MX-6 paste performs best, but with only 0.3°C and 0.4°C difference, the good old MX-4 paste is incredibly close behind. In a cooler comparison, we would assume a clear draw with such a narrow difference. However, since all influencing factors were the same in this test except for the thermal compound, we can grant the MX-6 thermal compound a razor-thin lead by a hair’s breadth. However, we cannot speak of a real difference that would make a usable advantage in practice. The fact that the MX-5 paste could also keep up so well was honestly a positive surprise for us. Although it had already partially disintegrated into its components again, its lag of 1.5°C at the hottest core and 1.7°C at the coolest core turned out lower than expected.
Let us now come to our conclusion.
Arctic thermal paste Result and general impression …


