
AMD Ryzen 9 7950X benchmark results …
For the benchmarks, we chose the following programs, which can be downloaded from the following download page.
Quickly to the right benchmark …
| Benchmark Tools |
| Cinebench R23 |
| Cinebench R15 |
| CPU-Z |
| PCMark 10 |
| 3DMark |
All benchmarks were run several times with BIOS default settings and the result was averaged afterwards.
To first get an impression of the performance of an AMD Ryzen 5 7600X compared to the AMD Ryzen 9 7950X CPU, here is the Cinebench R23 benchmark without overclocking in direct comparison:
Cinebench R23 …
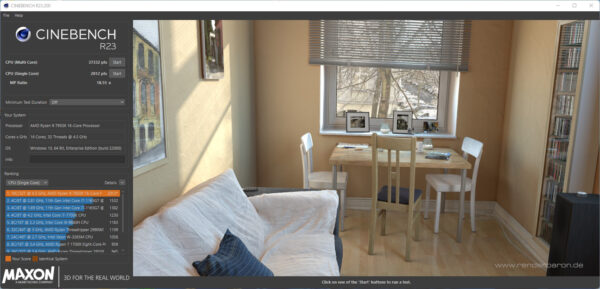
| Cinebench R23 | AMD Ryzen 5 7600X | AMD Ryzen 9 7950X |
| Single Core | 2012 pts | 2012 pts |
| Multi Core | 15145 pts | 37332 pts |
As you can see very nicely, the Multi Core Benchmark of the AMD Ryzen 9 7950X CPU is more than twice as fast as the Multi Core Benchmark of an AMD Ryzen 5 7600X CPU, which is of course made possible by the different number of cores. The number of cores is about 2.66x as high and the result is about 2.46x higher.
After the standard run without overclocking, the performance preset “PBO, 85°C, Curve Optimizer -40mV” was activated in the BIOS for the test results with overclocking and all tests were run again.
Cinebench R15 …
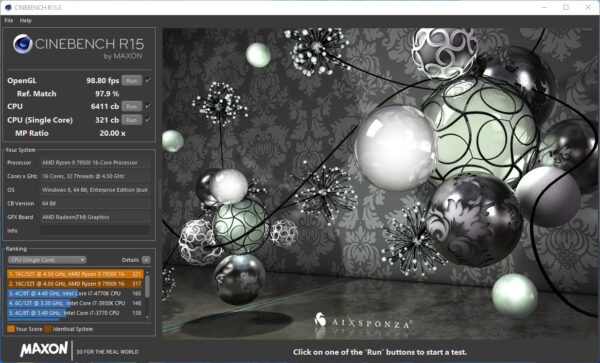
| Cinebench R15 | standard | overclocked |
| Single Core | 317 cb | 321 cb |
| Multi Core | 6127 cb | 6411 cb |
Cinebench R15 scales very well with overclocking on the AMD Ryzen 9 7950X, as it did on the AMD Ryzen 5 7600X. After selecting the performance preset, a significantly higher clock rate could be noticed during the runs, especially in the multi-core test. This is also reflected in an approximately 5% better overall result. In the single-core test, there was a score increase of about 1.2%.
CPU-Z …
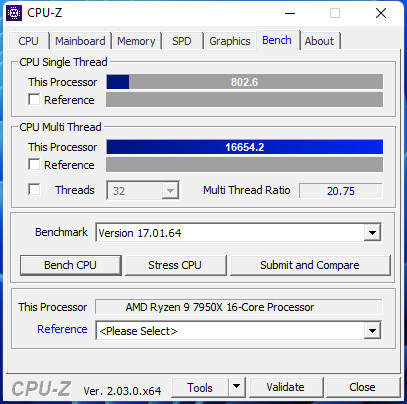
| CPU-Z V2.03.0.x64 | standard | overclocked |
| V17.01.64 Single Thread | 788,0 | 802,6 |
| V17.01.64 Multi Thread | 15793,0 | 16654,2 |
In the CPU-Z Multi Thread benchmark, the AMD Ryzen 9 7950X CPU could achieve about a 5.5% better overall result with PBO overclocking and in the CPU-Z Single Thread benchmark, the performance still increased by about 1.85%.
PCMark 10 …
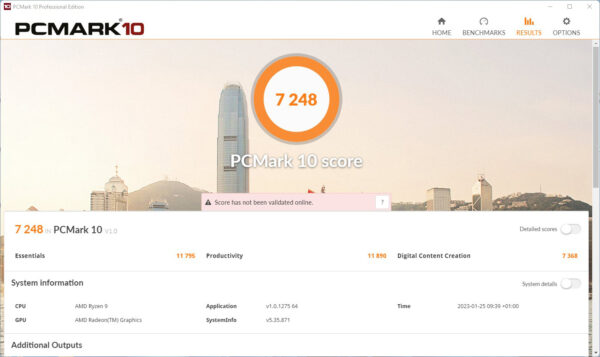
In PCMark 10, a total score of 7248 points was achieved with the integrated AMD Radeon Graphics graphics unit.
3DMark …
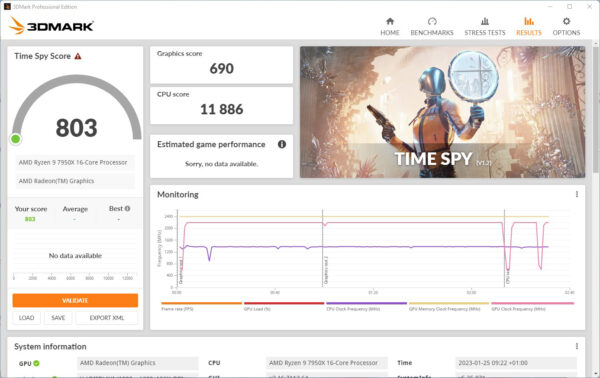
3D Mark Time Spy …
In the 3D Mark Time Spy benchmark, the total score with the integrated AMD Radeon Graphics was just 803 points due to the higher weighting of the graphics unit and should definitely be improved drastically with a dedicated graphics card for gaming.
AMD Ryzen 9 7950X Power consumption and temperatures …

