Let us continue with the benchmark results. SATA3 drives are currently tested with an ASRock 890GX Extreme3 motherboard. At present, Microsoft Windows 7 Ultimate Edition is used as the operating system.
The SSD drive speed was examined and compared with the following benchmark software:
AS SSD Benchmark 1.4.3704.27281 – Download
ATTO Disk Benchmark v2.46 – Download
CrystalDiskMark 3.00 – Download
HD Tach 3.040 – Download
SiSoftware Sandra 2011 – Download
The SSD benchmark values offers a very good reference point of the maximal possible reading and writing performance, the speed with smaller files and the respective access time.
In RAID mode 1x SSD at the SATA3 controller reached like in IDE mode a significantly lower performance than in AHCI mode despite correct alignment. Individual tests of a SSD in IDE mode, in RAID mode and in AHCI mode, were already done in previous tests. Now it’s about the performace of 1x Crucial m4 256GB vs 1x Crucial m4 128GB vs 2x Crucial m4 128GB SSD.
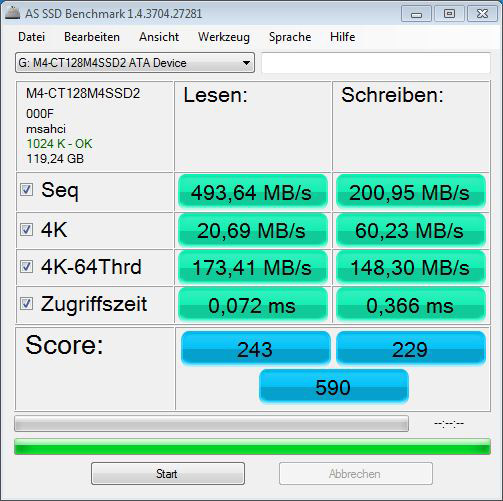
Here is a Snipping screenshot of the AS SSD benchmark results (1x Crucial m4 128GB SATA3 AHCI):
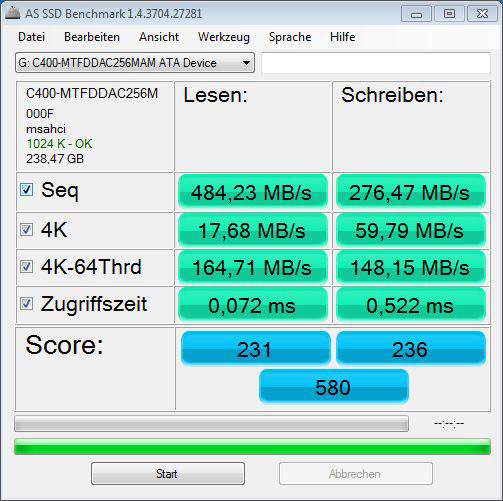
Here is a Snipping screenshot of the AS SSD benchmark results (1x Crucial m4 256GB SATA3 AHCI):
Here is a Snipping screenshot of the AS SSD benchmark results (2x Crucial m4 128GB at SATA3 RAID Controller as RAID0 64KB):
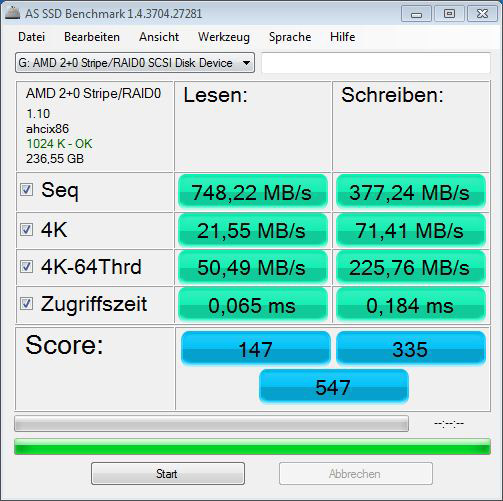
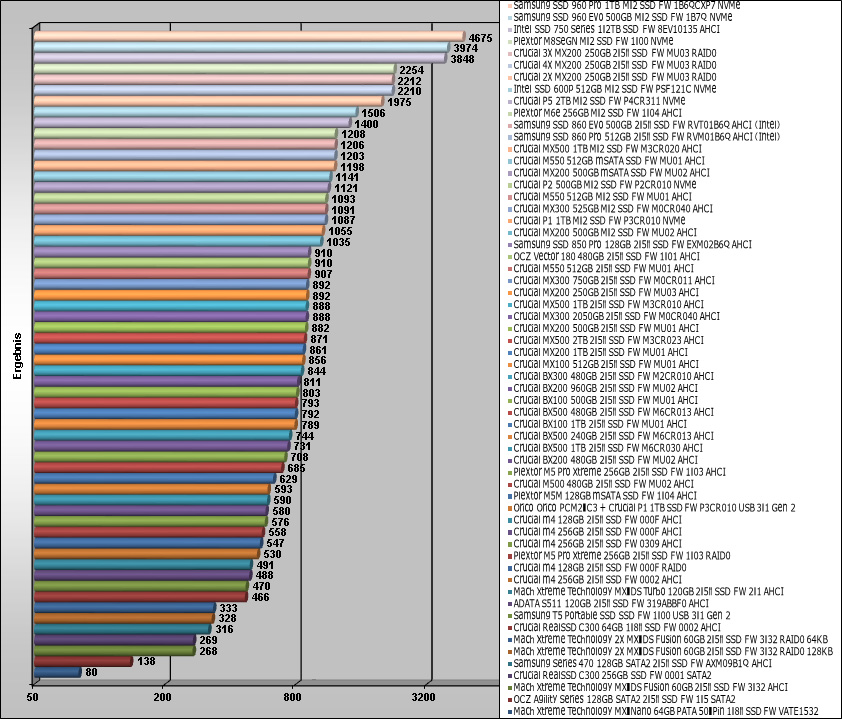
Regarding the total score, the Crucial m4 128GB reached in AS-SSD 590 points, which is a bit above the result of the Crucial m4 256GB with 580 points, followed by the two Crucial m4 128GB combined in RAID 0 with 547 points. If you look at the values more accurately, the comparison looks a bit different:
1x Crucial m4 128 GB SSD in AHCI reached a reading of 493.63 MB/s and a write value of 200.95 MB/s
1x Crucial m4 256 GB SSD in AHCI reached an almost identical reading value of 484.23 MB/s and caused by the Crucial SSD layout a much better write value of 276.47 MB/s
2x Crucial m4 128GB SSDs in RAID0 reached the so far absolutely highest reading value of 748.22 MB/s and still a very impressive write value of 377.24 MB/s.
It may confuse one or the other, why the RAID array has achieved with such high transfer rates only the lowest total score. This is due to the very high weighting of the “4K 64Thrd” values in the AS-SSD Benchmark tool. 4K means that small 4K blocks are read and/or written and with the 4K 64Thrd this is distributed on 64 Threads at the same time. Thus the benchmark program simulate for example a typical program start.
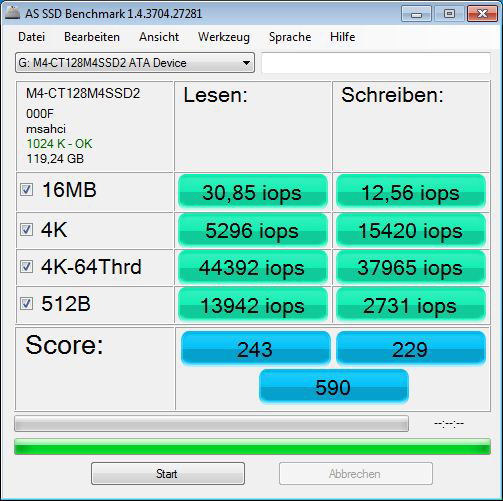
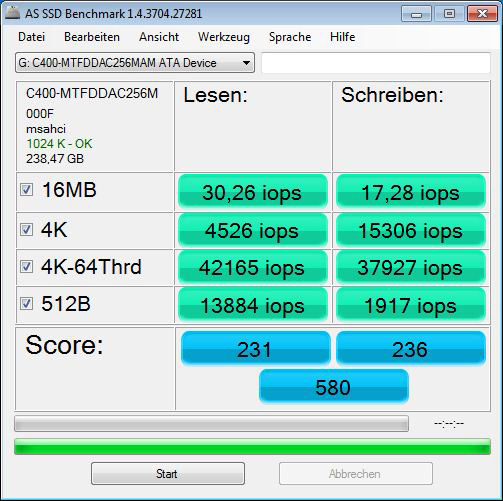
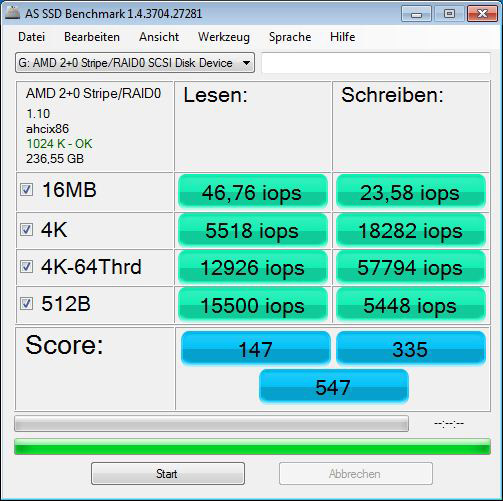
How big the difference is, becomes even clearer in the iops value comparison where the data input and output performance of 44392 drops to 12926 and thus can delay quick file access:
Here is a Snipping screenshot of the AS SSD iops results to measure the input/output speed (1x Crucial m4 128GB SATA3 AHCI):
Here is a Snipping screenshot of the AS SSD iops results (1x Crucial m4 256GB SATA3 AHCI):
Here is a Snipping screenshot of the AS SSD iops results (2x Crucial m4 128GB at SATA3 RAID Controller as RAID0 64KB):
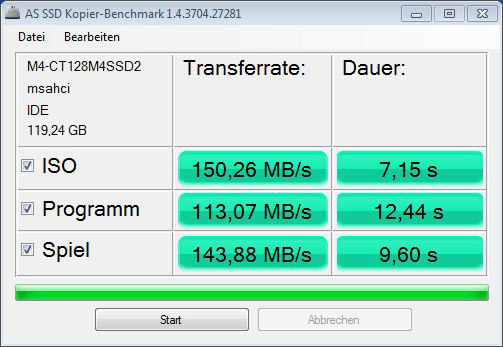
In order to get an impression of the speed, we tested also the ISO, program and game copy benchmark. Here is a Snipping screenshot of the AS SSD copy benchmark (1x Crucial m4 128GB SATA3 AHCI):
Here is a Snipping screenshot of the AS SSD copy benchmark (1x Crucial m4 256GB SATA3 AHCI):
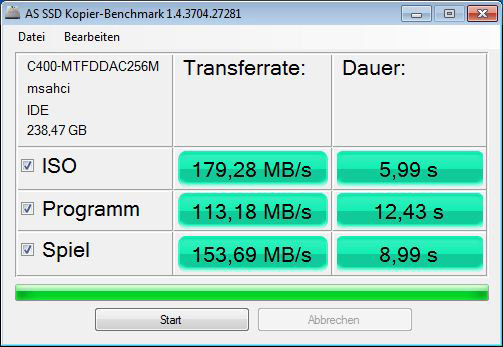
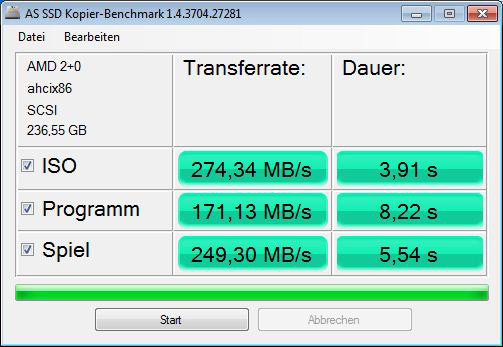
Also the AS SSD copy benchmark values of both SSD in RAID 0 are nearly twice as fast as one single SSD, which results in half of the copy time (2x Crucial m4 128GB at SATA3 RAID Controller as RAID0 64KB):
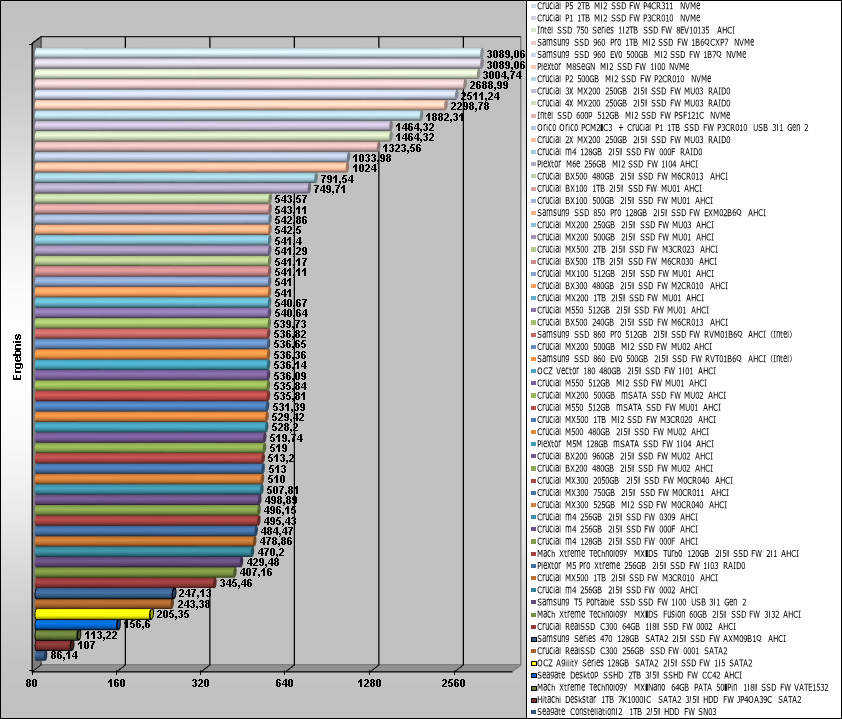
The comparison of the AS SSD benchmark results is extended with each new HDD/SSD test. Here we see several SSDs in comparison to the Crucial m4 128GB 2.5″ SSD in RAID0, IDE and in AHCI mode, whereby the diagram is updated shortly with new SSDs. Currently, one Crucial m4 128GB SSD in AHCI is at the top, directly followed by the Crucial m4 256GB SSD in AHCI. The peak in the lower diagram part is the read and write rate of the Crucial RAID0 m4 128GB.
Here is a comparison of the AS SSD benchmark values, which are getting updated with soon coming drives:
The ATTO disk benchmark values gives a very good overview about the write and read rate on different file sizes. These values are maximum ratings, which are different to the previously continuous transfer rate benchmarks.
Here is a Snipping screenshot of the ATTO Disk benchmark values (1x Crucial m4 128GB SATA3 AHCI):
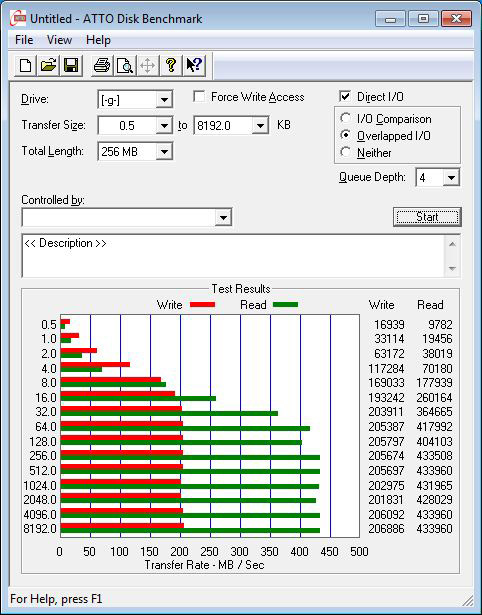
Here is a Snipping screenshot of the ATTO Disk benchmark values (1x Crucial m4 256GB SATA3 AHCI):
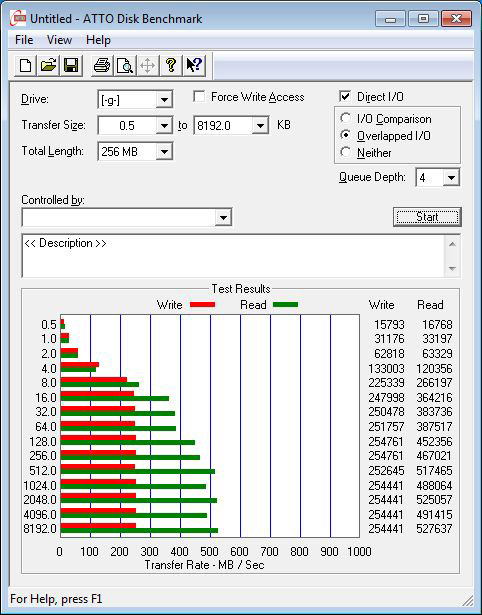
Here is a Snipping screenshot of the ATTO Disk benchmark values (2x Crucial m4 128GB at SATA3 RAID Controller as RAID0 64KB):
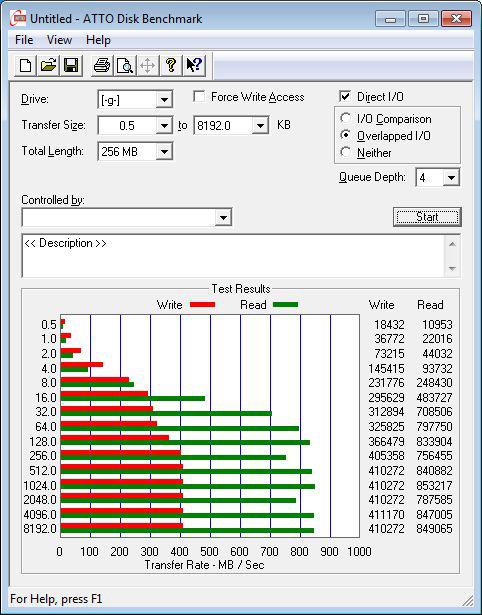
Both, the write performace (red) and the read performance (green) of the SSDs in RAID0 array are beginning at 16K nearly twice as fast as the bandwidth of one single SSD at the RAID controller. This compensates in RAID0 even the write value differences of the two smaller SSDs clearly.
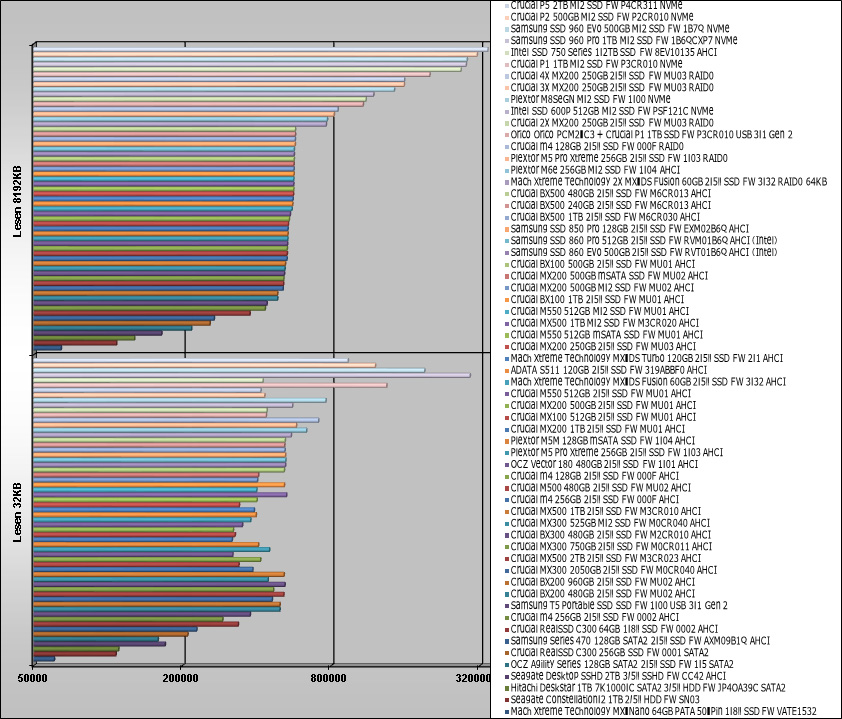
The ATTO disk benchmark values are compared with a small transfer size of 32KB and a large transfer size of 8192KB. The bar chart already shows a first comparison to the Hitachi Deskstar 7K1000.C 1TB hard disk drive, the OCZ Agility 120GB SSD, the Crucial 256GB C300 RealSSD, the three upper constellations and a several other SSDs, where the Crucial m4 in RAID reached the very best 8192K result.
Here is a comparison of the ATTO disk benchmark values, which are getting updated with soon coming drives:
With CrystalDiskMark one receives a balanced measurement of the performance with different transfer sizes.
Here is a Snipping screenshot of the CrystalDiskMark values (1x Crucial m4 128GB SATA3 AHCI):
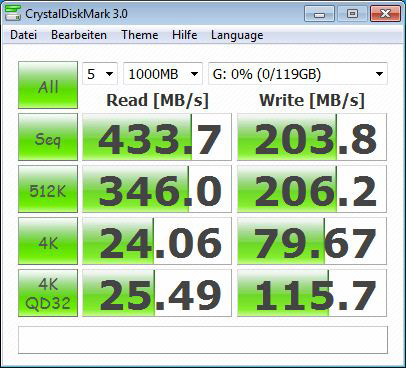
Here is a Snipping screenshot of the CrystalDiskMark values (1x Crucial m4 256GB SATA3 AHCI):
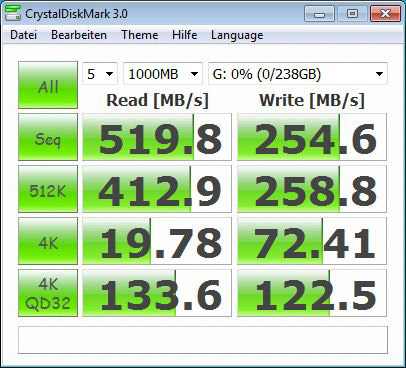
Here is a Snipping screenshot of the CrystalDiskMark values (2x Crucial m4 128GB at SATA3 RAID Controller as RAID0 64KB):
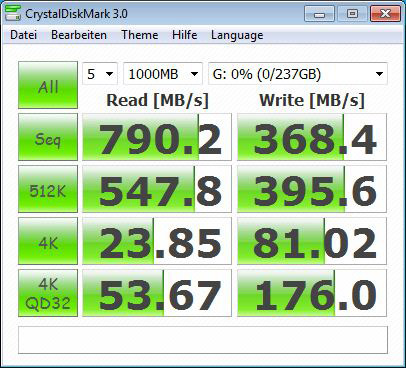
As seen in the previous 4K-64Threads results, the read 4K QD32 value is nearly one third lower, but the sequential read and write result of both Crucial m4 128GB is much higher when operating as RAID0.
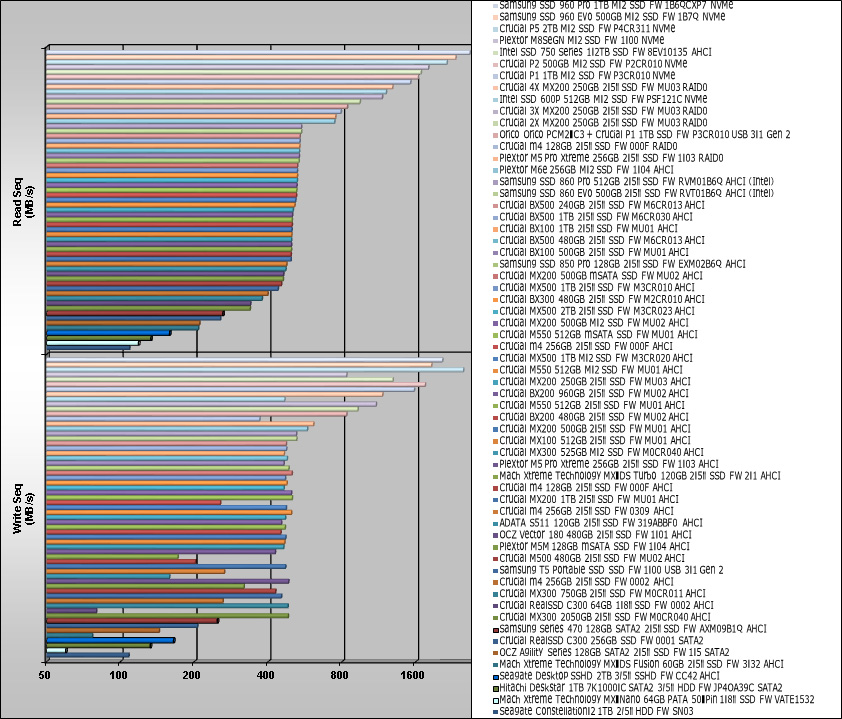
The following diagram shows the CrystalDiskMark results once again compared with other SSDs and platter drives, which are extended step by step. In the CrystalDiskMark comparison one can see significant differences between the to-date tested of the Solid State Drives and Hard Disk Drives, where the two tested Crucial m4 128GB SSDs in RAID0 are with their read and write performance at the top of all currently tested drives.
Here is a comparison of the CrystalDiskMark values, which are getting updated with soon coming drives:
With HD Tach one can measure the gradient of the performance, but the SSD transfer is not comparable with a conventional HDD. New logical NAND cell access of the SSD controller results in varying values like some other equal build SSDs tested with the latest HD Tach Version 3.0.4.0 version. HD Tach measured with the two Crucial m4 128 GB SSDs in RAID0 a relatively constant read and write rate with high transfer rates and extremely low access times of approx. 0.1ms. To compare these results you can move the mouse over the following drives to see their respective benchmark results:2x Crucial m4 128GB 2.5″ SSD at SATA3 RAID, Crucial m4 128GB 2.5″ SSD at SATA3 AHCI, Crucial m4 128GB 2.5″ SSD at SATA3, Crucial m4 256GB 2.5″ SSD FW 000F at SATA3 AHCI, Crucial m4 256GB 2.5″ SSD FW 0309 at SATA3 AHCI, Crucial m4 256GB 2.5″ SSD FW 0002 at SATA3 AHCI, Crucial m4 256GB SSD FW 0309 at SATA3 IDE, Crucial m4 256GB 2.5″ SSD FW 0002 at SATA3, ADATA S511 120GB SSD at SATA3 AHCI, ADATA S511 120GB SSD at SATA3 AHCI, Crucial C300 64GB 1.8″ SSD at SATA3, Crucial RealSSD 256GB 2.5″ SSD at SATA3, Crucial RealSSD 256GB 2.5″ SSD at SATA2, MX-DS Fusion 60GB SSD SATA3 IDE, MX-DS Fusion 60GB SSD SATA3 IDE, MX-DS Turbo 120GB SSD at SATA3 AHCI, OCZ Agility 128GB SSD, Samsung Series470 128GB SSD AHCI, Samsung Series470 128GB SSD Legacy IDE, Hitachi 7K1000.C 1TB disk drive and Toshiba MK8007GAH 1.8″ disk drive.
Here is a Snipping screenhot of the HD Tach benchmark values:
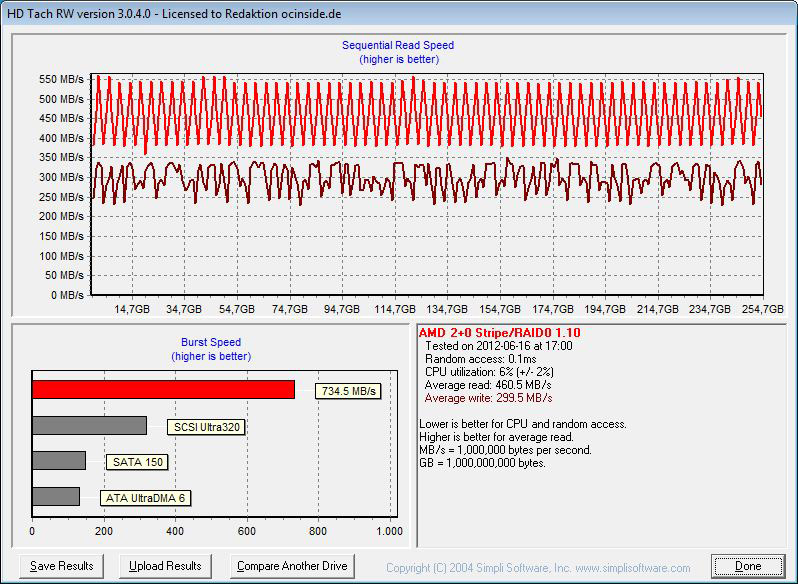
The comparison of the HD Tach benchmark results shows very impressive the fast reading speed, writing speed and the average access time of the two Crucial m4 128GB 2.5-inch SSDs as RAID0 array.
Here is an impressive comparison of the HD Tach benchmark values, which are getting updated with soon coming drives:
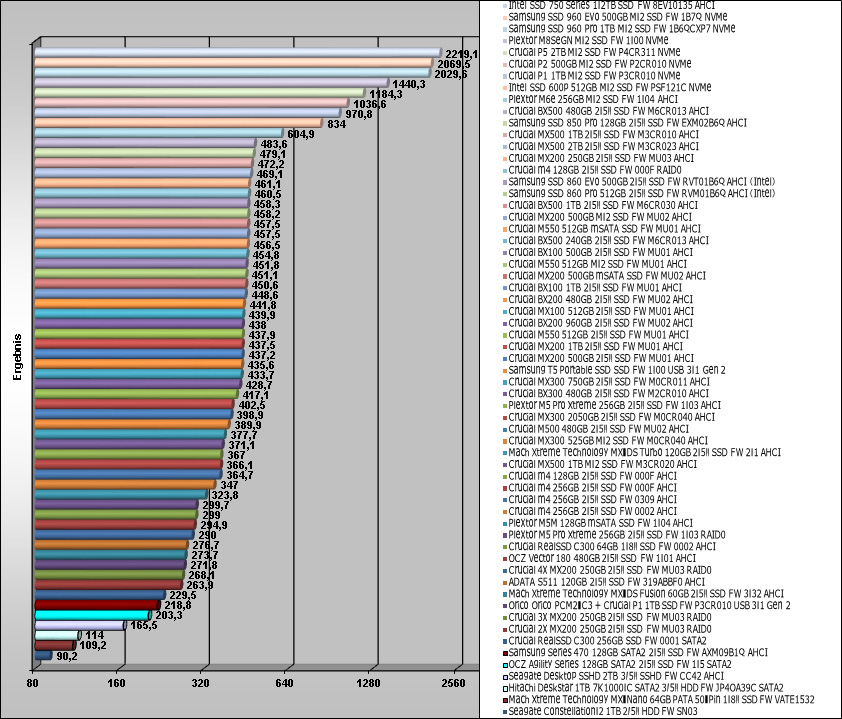
SiSoftware Sandra benchmark result
Of course, SiSoftware Sandra benchmark should not be missing in this test series. SiSoftware offers with their SiSoft Sandra program a very comprehensive tool, which contains a lot of tools to get very reliable test results of all hardware components.
Here is a Snipping screenshot of the SiSoftware Sandra benchmark values (1x Crucial m4 128GB SATA3 AHCI):

Here is a Snipping screenshot of the SiSoftware Sandra benchmark values (1x Crucial m4 256GB SATA3 AHCI):

Here is a Snipping screenshot of the SiSoftware Sandra benchmark values (2x Crucial m4 128GB at SATA3 RAID Controller as RAID0 64KB):

Here is a comparison of the SiSoftware Sandra benchmark values, which are getting updated with soon coming drives:
