Let us continue with the benchmark results. SATA2 drives are currently tested with an ASRock M3A790GXH/128M motherboard and SATA3 drives are currently tested with an ASRock 890GX Extreme3 motherboard. At present, Microsoft Windows 7 Ultimate Edition is used as the operating system. Below is additionally a performance comparison between the 1.8″ SSD vs HDD out of the Toshiba R400 notebook.
The SSD drive speed was examined and compared with the following benchmark software:
AS SSD Benchmark 1.4.3704.27281 – Download
ATTO Disk Benchmark v2.46 – Download
CrystalDiskMark 3.00 – Download
HD Tach 3.040 – Download
SiSoftware Sandra 2010c – Download
The SSD benchmark values offers a very good reference point of the maximal possible reading and writing performance, the speed with smaller files and the respective access time. The 60GB MX drive achieved no very high sequential read or write rates, but we didn’t expect that with this interface. But nevertheless, with approximately 112 MB/s, it was possible to reach nearly the same read transfer rate of a 7200 rpm HDD. The write performance was approximately 53 MB/s, which is about a quarter lower than the result of the 64GB 1.8″ SATA3 RealSSD. The overall score reached 80 points.
Here is a Snipping screenshot of the AS SSD benchmark results:
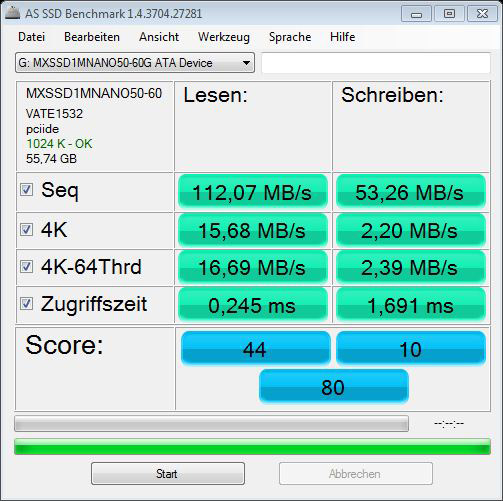
In AHCI mode the important value “4K-64Thrd” would be much higher than in the IDE mode. 4K means that small 4K blocks are read and/or written and with the 4K 64Thrd this is distributed on 64 Threads at the same time. Thus the benchmark program simulate for example a typical program start. Since the weighting of this value is very high in the ASSSD benchmark tool, it would increase the total score in AHCI mode very high.
Hint: Who think about changing its SATA port in the BIOS from native IDE and/or legacy IDE to AHCI, should change first for example (if possible) only one part of the SATA port, where the drive with the operating system is not installed. Because if one like to save the new Windows installation, one must install the hard disk controller driver before changing SATA mode from IDE to AHCI – alternatively there are also Registry entries for it. Of course we help you with questions to this topic or all other PC related questions 24/7 in our German and English written PC Forum. There are many differences between the conventional native IDE mode and the modern AHCI mode, which offers beside the higher performance also advantages like e.g. the support of NCQ (Native Command Queuing) or Hot-Plug. Anyway, we did not compare these values in this notebook drive review, because this SSD is connected to the PATA port of the notebook, where is no AHCI mode available in the BIOS.
And here is a Snipping screenshot of the AS SSD iops results to measure the input/output speed:
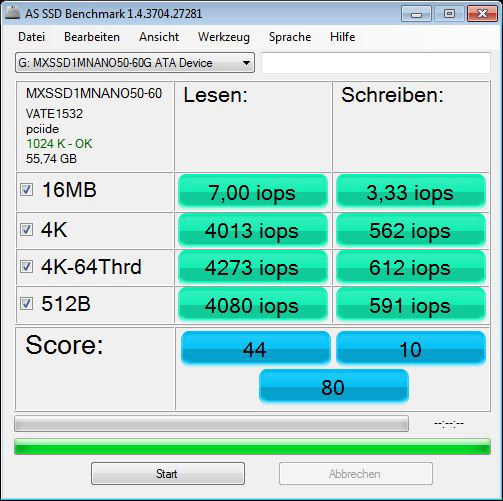
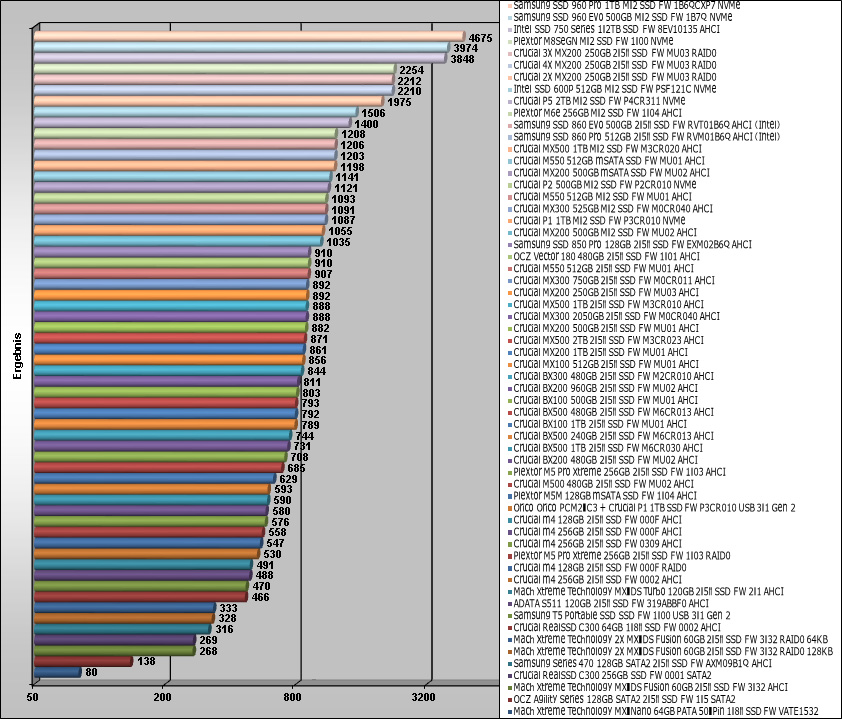
The comparison of the AS SSD benchmark results is extended with each new HDD/SSD test. Here we see the OCZ Agility 128GB SATA2 SSD in comparison to the Crucial RealSSD C300 64GB 1,8″ SSD in IDE and in AHCI mode and a comparison to the Crucial RealSSD C300 256GB 2,5″ SSD on a SATA-3 controller and on a SATA-2 controller, whereby the diagram is updated shortly with new SSDs.
Here is a comparison of the AS SSD benchmark values, which are getting updated with soon coming drives:
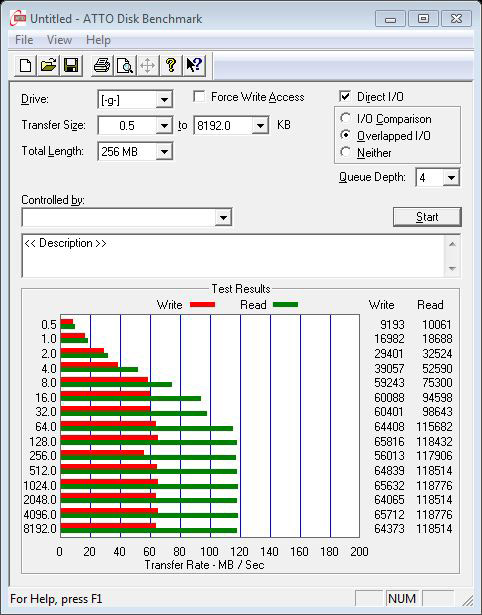
The ATTO disk benchmark values gives a very good overview about the write and read rate on different file sizes. Approx. 60 MB/s write performance and 120 MB/s of higher transfer sizes are relatively low.
Here is a Snipping screenshot of the ATTO Disk benchmark values:
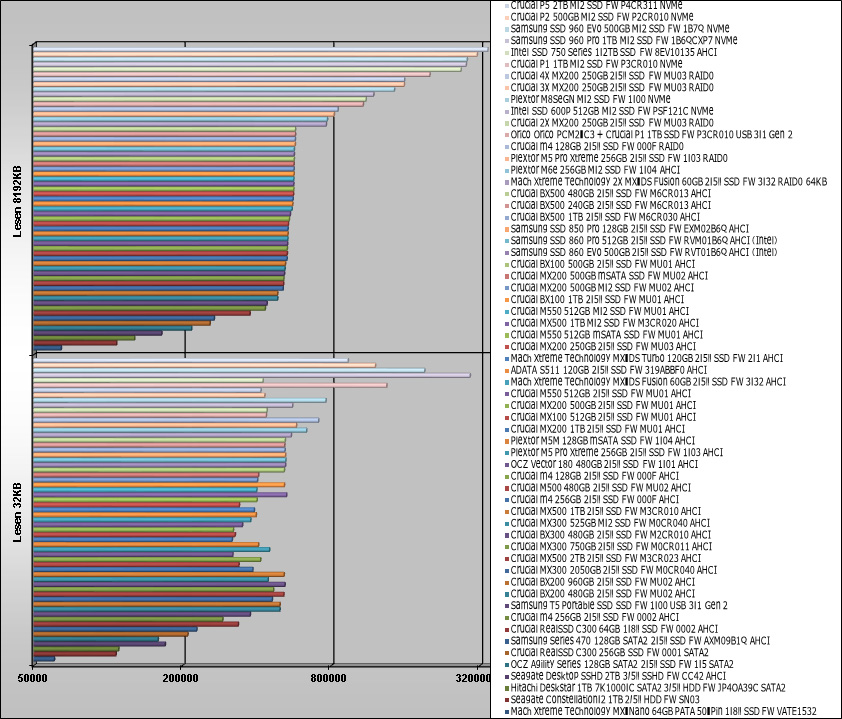
The ATTO disk benchmark values are compared with a small transfer size of 32KB and a large transfer size of 8192KB. The bar chart already shows a first comparison to a Hitachi Deskstar 7K1000.C 1TB hard disk drive, the OCZ Agility 120GB SSD, the Crucial 256GB C300 RealSSD and Crucial’s 64GB 1.8″ C300 RealSSD in IDE and in AHCI, whereby the write results of the tiny 1.8″ PATA SSD has nearly the same performance than a fast 3.5″ 7200 rpm hard disk and this is a good result for this notebook SSD.
Here is a comparison of the ATTO disk benchmark values, which are getting updated with soon coming drives:
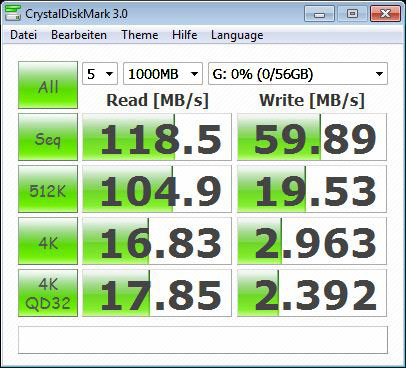
With CrystalDiskMark one receives a balanced measurement of the performance with different transfer sizes.
Here is a Snipping screenshot of the CrystalDiskMark values:
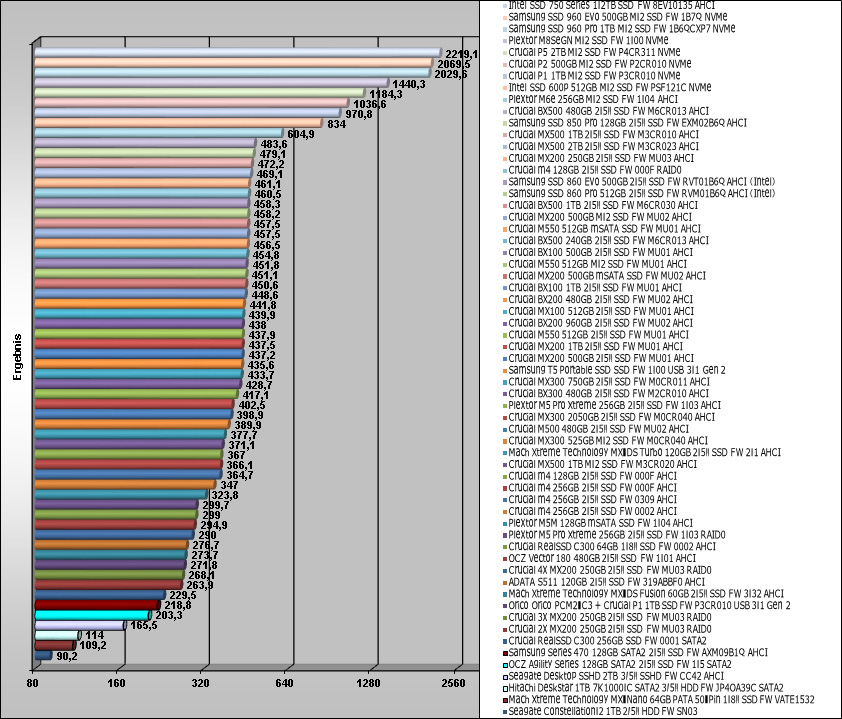
The following diagram shows the CrystalDiskMark results once again compared with other SSDs and platter drives, which are extended step by step. In the CrystalDiskMark comparison one can see huge differences of the 60GB 1.8-inch MX-NANO compared to a conventional 3.5″ 7200 rpm disk. In CrystalDiskMark are only the sequential read- and write results higher than the performance of the 60GB Nano SSD. Both, read performance as well as write performance of the Nano SSD are clearly higher than the values of a much bigger Hitachi Deskstar 7K1000.C 1TB HDD.
Here is a comparison of the CrystalDiskMark values, which are getting updated with soon coming drives:
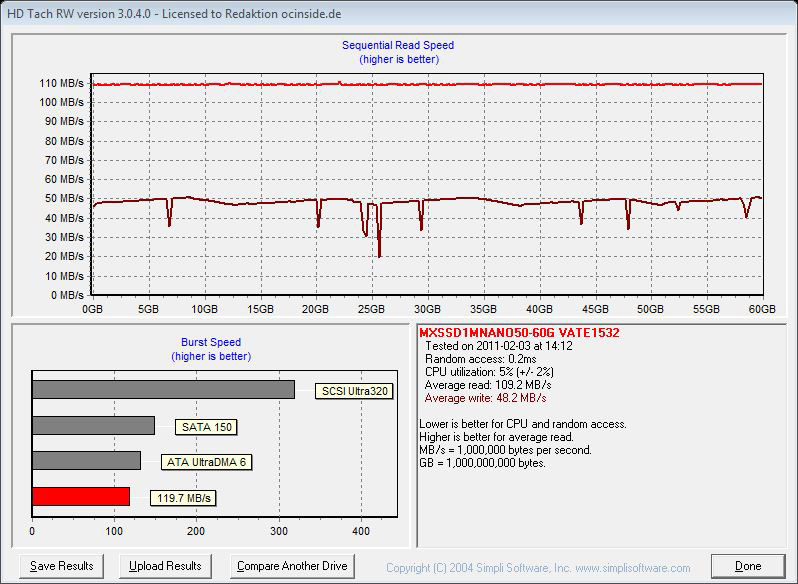
With the HD Tach benchmark values one can recognize the gradient of the performance. The Mach Xtreme Technology 60GB ATA 50-Pin 1.8″ SSD shows some break-downs in the write measurements, but has a very constant transfer with low access times of approx. 0.2ms.
To compare these results with values in a Toshiba Portege R400 notebook, you can move the cursor over this Mach Xtreme Technology 60GB PATA 50-Pin in Toshiba R400 Link.
Furthermore you can move the mouse over the following drives to see their respective benchmarkresults:Crucial RealSSD 64GB 1,8″ SATA3 SSD at SATA3, Crucial RealSSD 256GB 2,5″ SSD SATA3 at SATA3, Crucial RealSSD 256GB 2,5″ SSD SATA3 at SATA2, OCZ Agility 128GB SSD and Hitachi 7K1000.C 1TB Festplatte. But much more important is the comparison of the 1.8″ SSD results with a Toshiba MK8007GAH 1.8″ MCD-D50 PATA ZIF hard disk drive (Toshiba 50-Pin Embedded ATA also with 3.3 Volt, 4200 rpm). To compare this HDD vs SSD, you should move your mouse over this Toshiba MK8007GAH HDD link and get tears in your eyes if you own for example a Toshiba R400 Notebook with such a slow HDD. So it would be worth to upgrade such a HDD to a SSD to get a very high performance boost in comparison to the 4200 rpm MK8007GAH PATA hard disk drive – short read times and fast boot times will be the result.
Here is a Snipping screenhot of the HD Tach benchmark values:
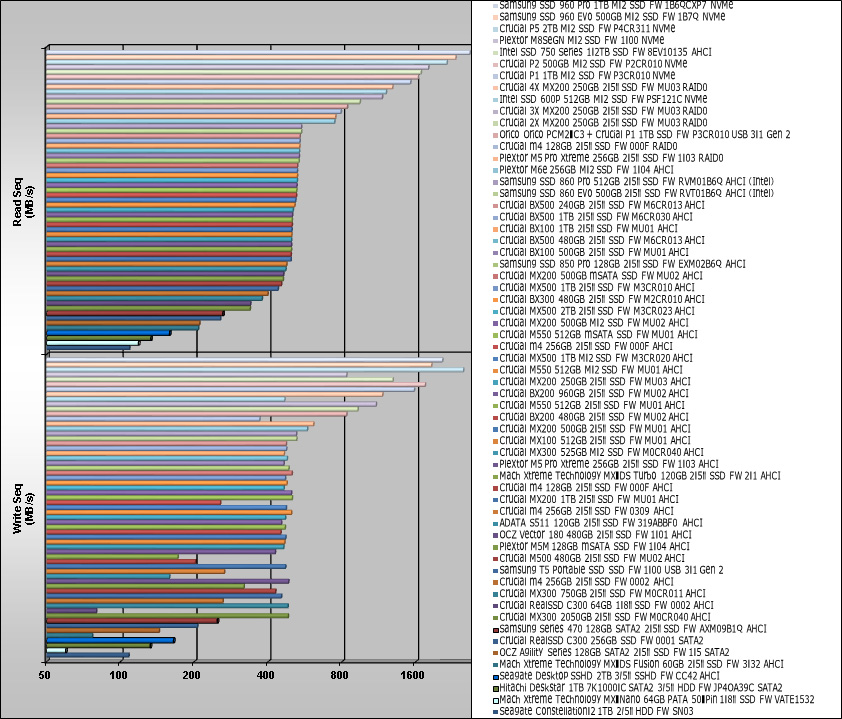
The comparison of the HD Tach benchmark results shows very impressive, the reading speed and the average access time of this Mach Xtreme Technology Nano SSD against other Solid State Drives and hard disk drives.
Here is an impressive comparison of the HD Tach benchmark values, which are getting updated with soon coming drives:
SiSoftware Sandra benchmark result
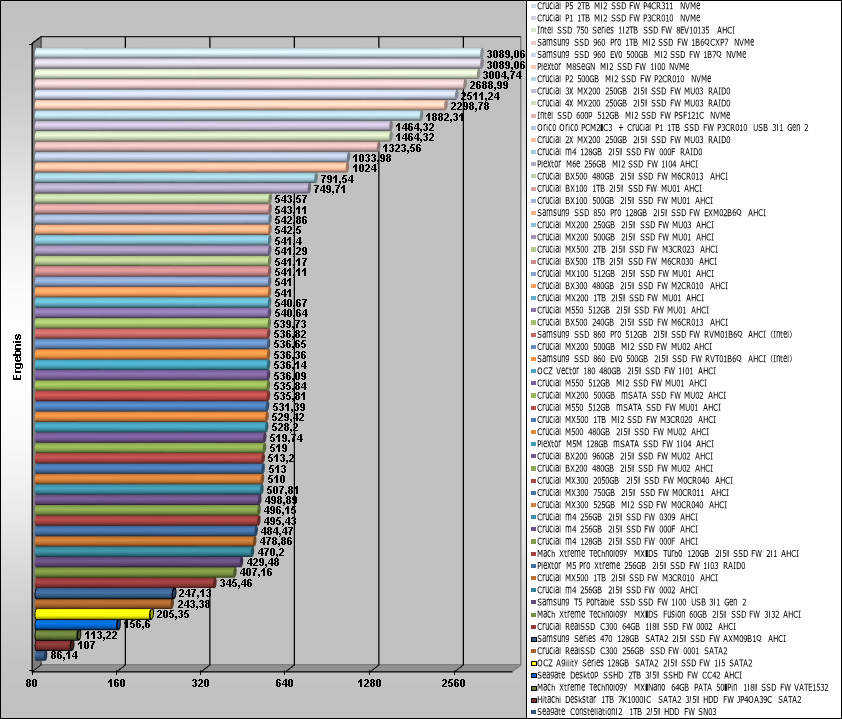
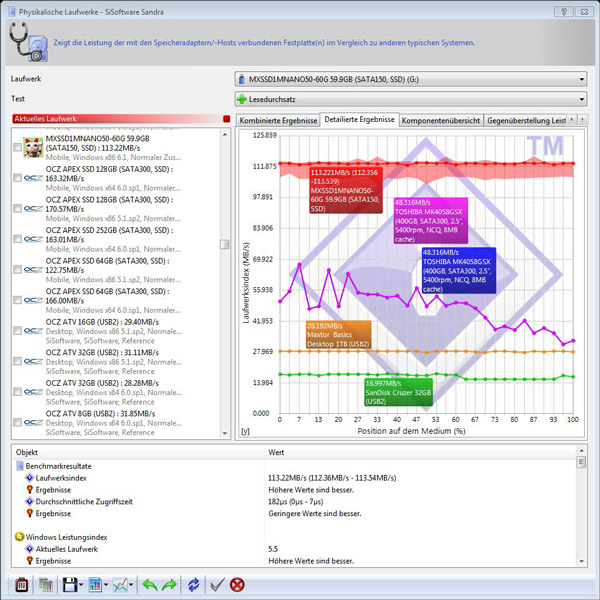
Of course, SiSoftware Sandra benchmark should not be missing in this test series. SiSoftware offers with their SiSoft Sandra program a very comprehensive tool for some years, which contains a lot of tools to get very reliable test results of all hardware components. The average access time of the MX Nano 60GB SSD was in SiSoftware Sandra with 182us relatively low and the drive index of 113.22 MB/s underscores the previous tests.
Here is a Snipping screenshot of the SiSoftware Sandra benchmark values:
Here is a comparison of the SiSoftware Sandra benchmark values, which are getting updated with soon coming drives:
