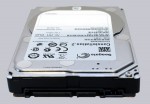
Let us continue with the benchmark results. SATA3 drives are currently tested with an ASRock 890GX Extreme3 motherboard. At present, Microsoft Windows 7 Ultimate Edition is used as the operating system.
The HDD drive speed was examined and compared with the following benchmark software:
AS HDD Benchmark 1.4.3704.27281 – Download
ATTO Disk Benchmark v2.46 – Download
CrystalDiskMark 3.00 – Download
HD Tach 3.040 – Download
SiSoftware Sandra 2011 – Download
The HDD benchmark values offers a very good reference point of the maximal possible reading and writing performance, the speed with smaller files and the respective access time. Because ASSSD however is not intended for platter hard drives, we have skipped this test.
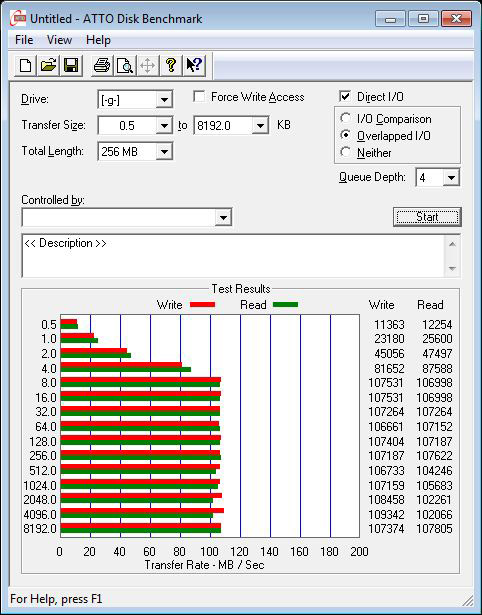
The ATTO disk benchmark values gives a very good overview about the write and read rate on different file sizes. Here you can see the very constant read and write speeds with approximately 108 MB/s at a small size of about 8 KB.
Here is a Snipping screenshot of the ATTO Disk benchmark values (SATA3):
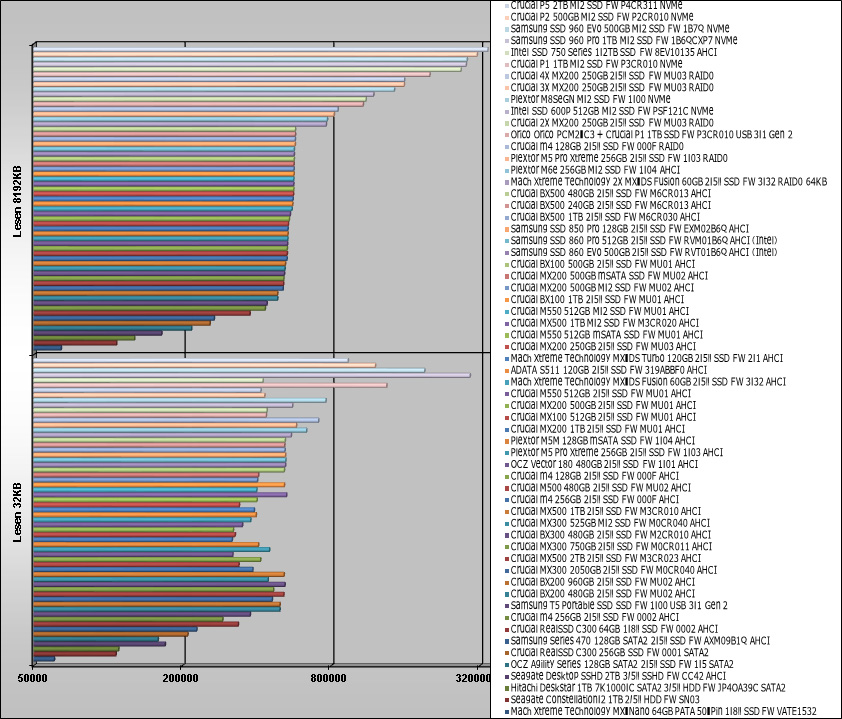
The ATTO disk benchmark values are compared with a small transfer size of 32KB and a large transfer size of 8192KB. The bar chart already includes a comparison to a Hitachi Deskstar 7K1000.C 1TB hard drive and some Crucial, OCZ, Mach Extreme and ADATA SSDs, with the Seagate Constellation.2 at 8192K transfer size well below the most SSDs.
Here is a comparison of the ATTO disk benchmark values, which are getting updated with soon coming drives:
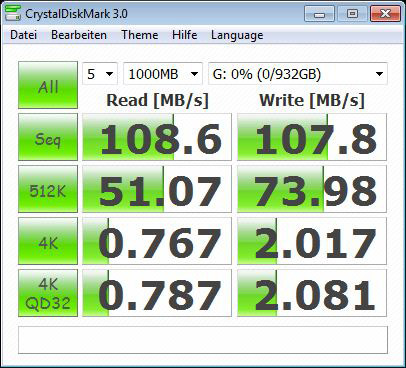
With CrystalDiskMark one receives a balanced measurement of the performance with different transfer sizes.
The CrystalDiskMark values show similar results as with ATTO and underline the almost-identical sequential read and write speeds of approximately 107-108 MB/s.
Here is a Snipping screenshot of the CrystalDiskMark values (SATA3):
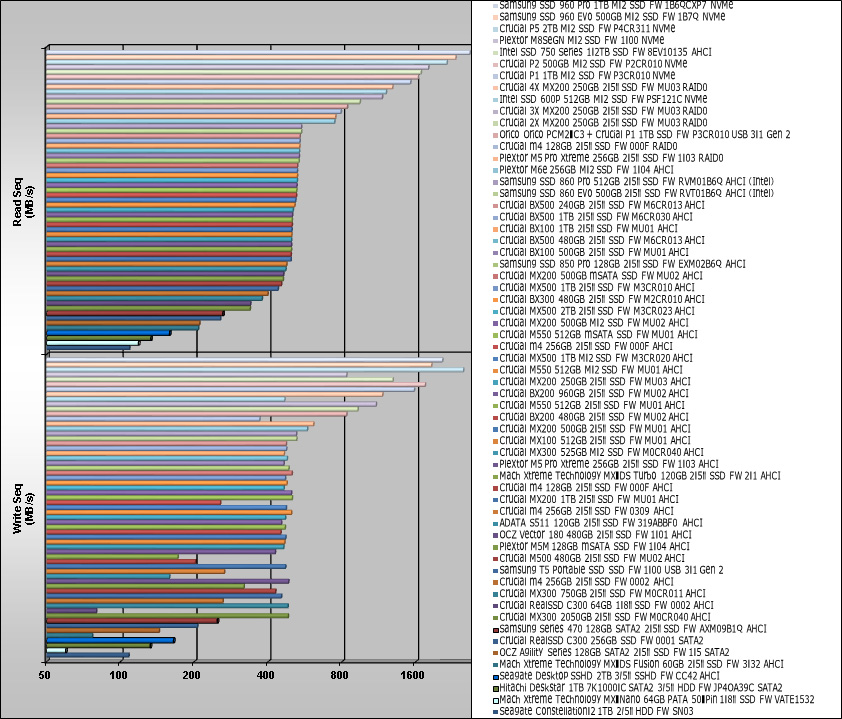
The following diagram shows the CrystalDiskMark results once again compared with other HDDs and platter drives, which are extended step by step. In the CrystalDiskMark comparison one can see significant differences between the to-date tested of the Solid State Drives and Hard Disk Drives, where the tested Seagate Constellation.2 1TB HDD is below most SSDs with the read performance, but the write performance is even significantly above some SSDs.
Here is a comparison of the CrystalDiskMark values, which are getting updated with soon coming drives:
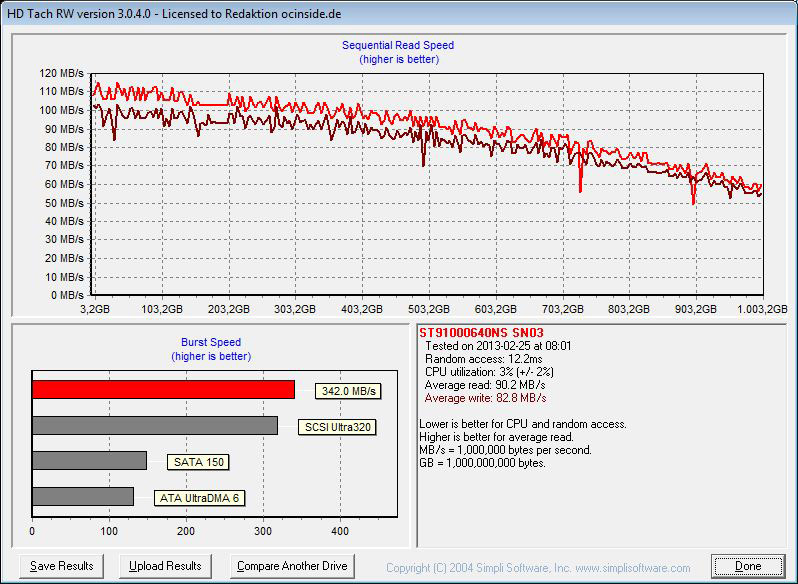
With HD Tach one can measure the gradient of the performance, but the HDD transfer is not comparable with a conventional HDD. Here, you get among other things a very good comparison to a SSD, which has nearly constant results. For technical reasons hard drives results falls from the beginning to the end of the drive. The Seagate Constellation.2 1TB HDD shows with the HD tach benchmark tool very few performance drops and offers even at the slowest part 55 MB/s read and write speed. For the burst speed helps the SATA3 interface to get these high transmission rates of approx. 342 MB/s. The average access time is with 12.2ms, below the 14.6ms value of a Hitachi Deskstar 7K1000.C 1TB 7200 RPM hard drive, with significantly improved write values as we soon see in the SiSoftware Sandra Benchmark. To compare these results you can move the mouse over the following drives to see their respective benchmark results:Seagate Constellation.2 1TB 2,5″ HDD at SATA3, 2x Crucial m4 128GB 2.5″ SSD at SATA3 RAID, Crucial m4 128GB 2.5″ SSD at SATA3 AHCI, Crucial m4 128GB 2.5″ SSD at SATA3, Crucial m4 256GB 2.5″ SSD FW 000F at SATA3 AHCI, Crucial m4 256GB 2.5″ SSD FW 0309 at SATA3 AHCI, Crucial m4 256GB 2.5″ SSD FW 0002 at SATA3 AHCI, Crucial m4 256GB SSD FW 0309 at SATA3 IDE, Crucial m4 256GB 2.5″ SSD FW 0002 at SATA3, ADATA S511 120GB SSD at SATA3 AHCI, ADATA S511 120GB SSD at SATA3 AHCI, Crucial C300 64GB 1.8″ SSD at SATA3, Crucial RealSSD 256GB 2.5″ SSD at SATA3, Crucial RealSSD 256GB 2.5″ SSD at SATA2, MX-DS Fusion 60GB SSD SATA3 IDE, MX-DS Fusion 60GB SSD SATA3 IDE, MX-DS Turbo 120GB SSD at SATA3 AHCI, OCZ Agility 128GB SSD, Samsung Series470 128GB SSD AHCI, Samsung Series470 128GB SSD Legacy IDE, Hitachi 7K1000.C 1TB disk drive and Toshiba MK8007GAH 1.8″ disk drive.
Here is a Snipping screenhot of the HD Tach benchmark values:
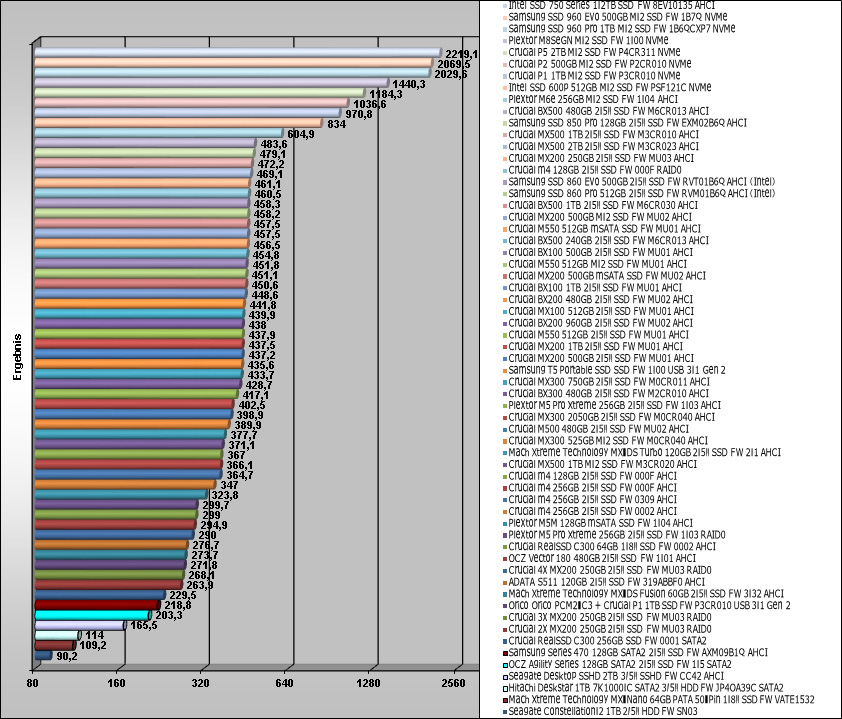
The comparison of HD Tach benchmark results shows in reading speed that the Seagate Constellation.2 1TB HDD of course can not keep up with the fast SSDs.
Here is an impressive comparison of the HD Tach benchmark values, which are getting updated with soon coming drives:
SiSoftware Sandra benchmark result
Of course, SiSoftware Sandra benchmark should not be missing in this test series. SiSoftware offers with their SiSoft Sandra program a very comprehensive tool, which contains a lot of tools to get very reliable test results of all hardware components.
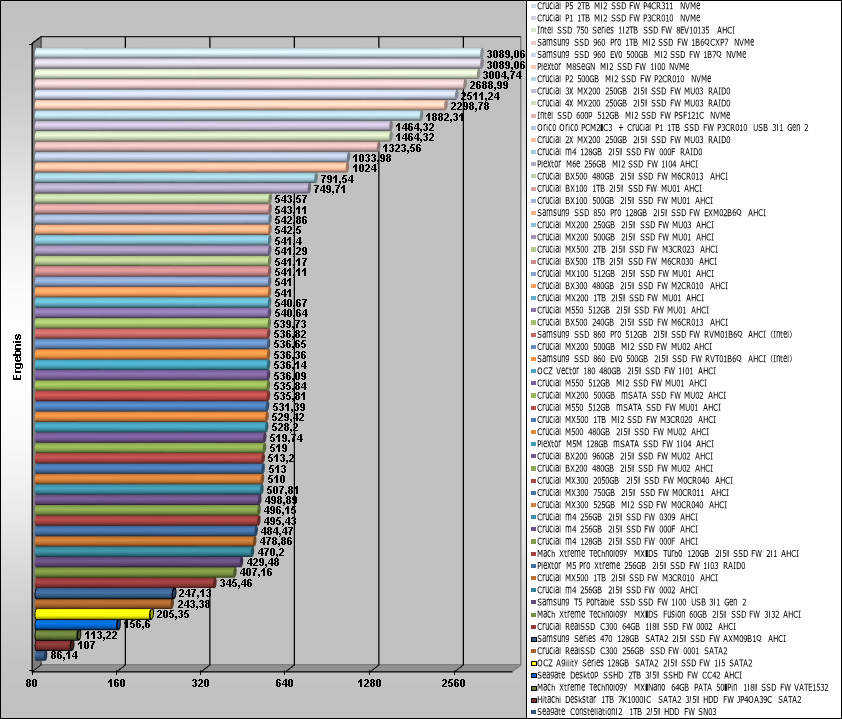
The average access time of the Seagate Constellation.2 1TB HDD measured also in SiSoftware Sandra approx. 12ms and the drive index reached 86.14 MB/s.
Here is a Snipping screenshot of the SiSoftware Sandra benchmark read performance (SATA3):

The average access time of the Seagate Constellation.2 1 TB HDD has with the SiSoftware Sandra writing measurement a surprisingly low value of 5.84ms and the drive index reached 85.55 MB/s.
Here is a Snipping screenshot of the SiSoftware Sandra benchmark write performance (SATA3):

Here is a comparison of the SiSoftware Sandra benchmark values, which are getting updated with soon coming drives:
